My Learning Journey - AI/ML with Python
From fundamental concepts to building and visualizing intelligent systems.
← Back to PortfolioDay 1
Python Basics for AI/MLPython Fundamentals
On the first day, I learned the basics of Python programming that form the foundation for AI and Machine learning. This included key concepts like **variables**, **data structures**, **control flow**, and **functions**. I also explored essential features like **list comprehensions** and **error handling** with `try-except` blocks.
Key Python Concepts:
- Variables and Data Types (Integers, floats, strings, booleans)
- Data Structures (lists, tuples, dictionaries, sets)
- Control flow (if statements, for and while loops)
- Functions and lambda expressions
- File I/O operations
- Error handling with try-except blocks
- List comprehensions
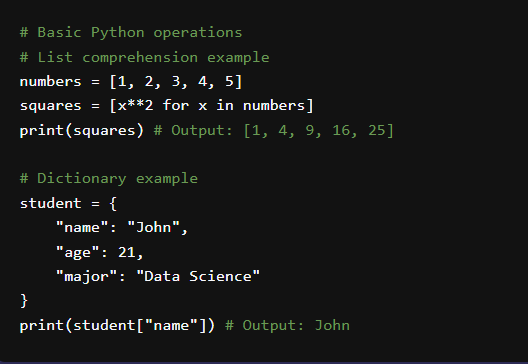
Understanding the core syntax of Python.
Day 2
NumPy LibraryNumerical Computing with NumPy
On the second day, we explored **NumPy**, the fundamental package for scientific computing in Python. I learned about its key feature: the powerful **N-dimensional array object**. This library is crucial for performing efficient numerical operations, linear algebra, Fourier transforms, and working with random numbers, which are all vital for AI and ML algorithms.
NumPy Key Features:
- Powerful N-dimensional array object
- Sophisticated broadcasting functions
- Tools for integrating C/C++ and Fortran code
- Linear algebra, Fourier transform, and random number capabilities
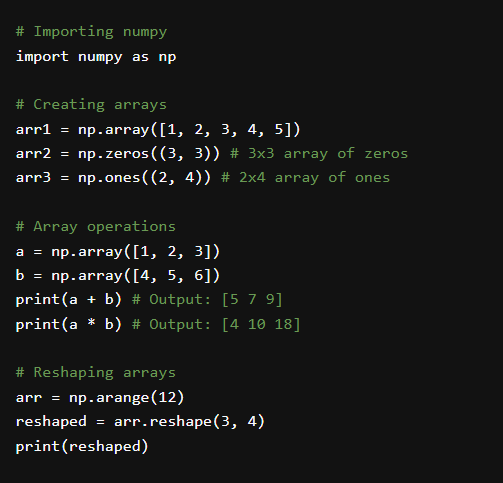
Efficient array manipulation with NumPy.
Day 3
MatplotlibData Visualization with Matplotlib
This day was all about bringing data to life through visualization using **Matplotlib**. I learned how to create a variety of static, animated, and interactive visualizations, including **line plots**, **scatter plots**, **bar charts**, and **histograms**. I also practiced customizing these plots with titles, labels, and legends to make them clear and informative.
Matplotlib Key Features:
- Line plots, scatter plots, bar charts, histograms
- Pie charts, stem plots, contour plots
- Customizable labels, titles, and legends
- Multiple subplots in one figure
- Save figures in various formats (PNG, PDF, SVG, etc.)
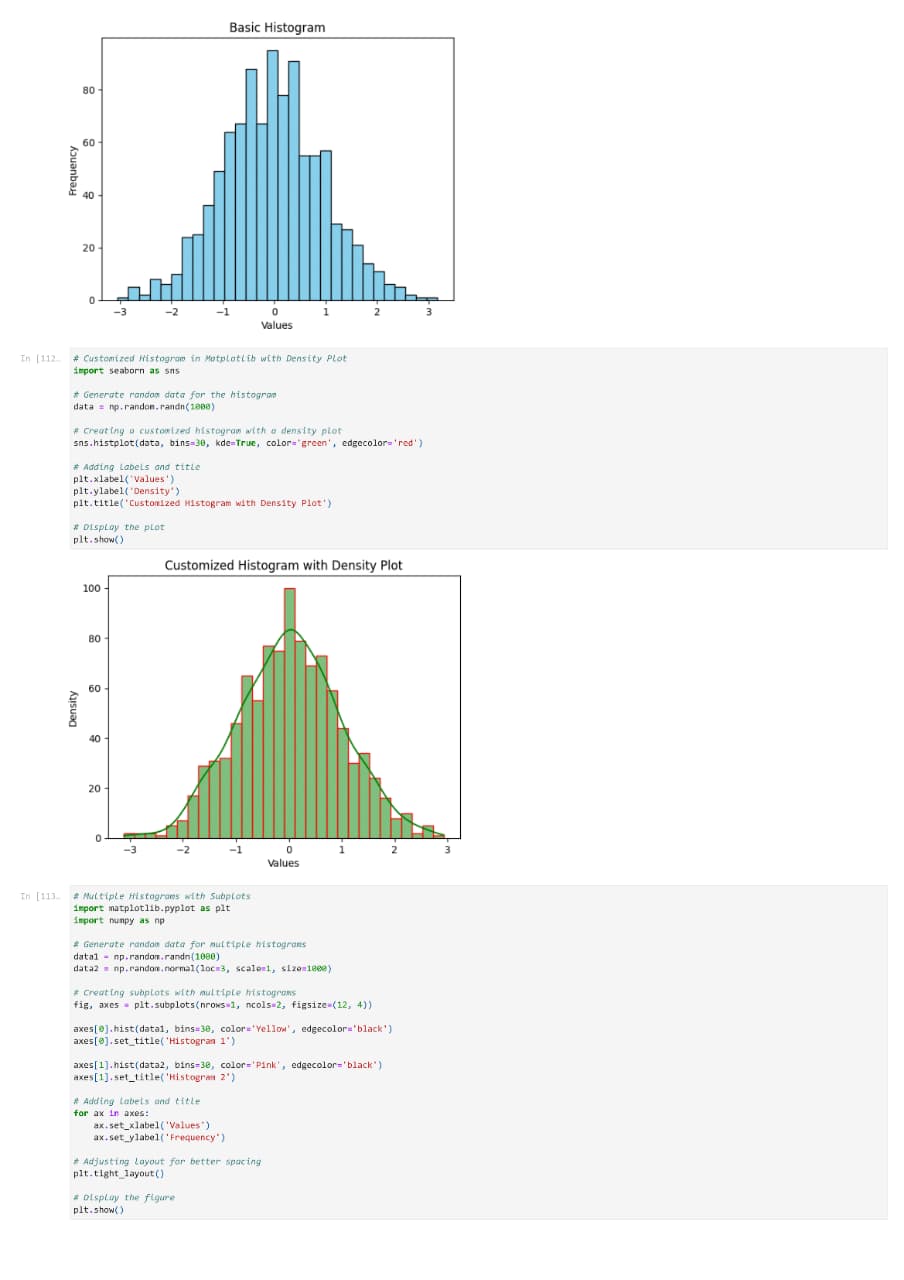
Creating insightful data plots with Matplotlib.
Day 4
Seaborn LibraryStatistical Data Visualization with Seaborn
On the fourth day, we explored **Seaborn**, a Python data visualization library based on Matplotlib. I learned how it provides a high-level interface for drawing attractive and informative statistical graphics. This included creating **violin plots** to visualize distributions, **heatmaps** for matrix-like data, and **pair plots** to explore relationships between multiple variables simultaneously.
Seaborn Key Features:
- Built-in themes for styling Matplotlib graphics
- Visualization of univariate and bivariate distributions
- Plotting statistical time series data
- Tools for fitting and visualizing linear regression models
- Functions for visualizing matrices and using color palettes
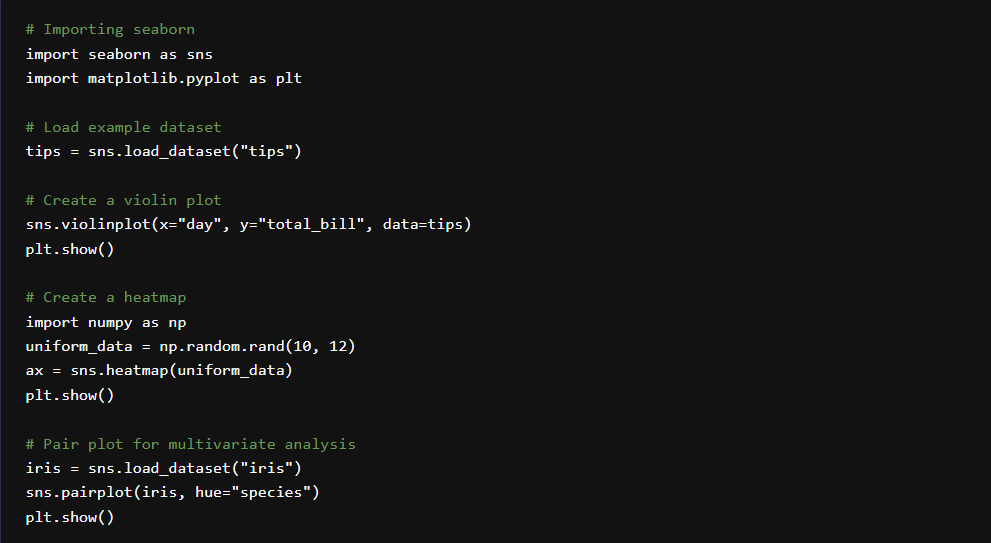
Advanced statistical visualizations with Seaborn.